|
SHARETIPSINFO >>Research Reports >> NTPC (24-12-2008)
LISTING |
|
|
Rs. 179 |
|
Rs. 290.75/ Rs. 113.00 |
|
Rs. 10 |
COMPANY OVERVEIW:
NTPC is government owned enterprise.
INSTALLED CAPACITY:
NTPC has power generation capacity of 29,144 MW. This is around 20% of the country`s total installed capacity. The company has ambitious plan to increase the capacity to 50000 MW by the end of eleventh five year plan (2007-2012). In order to achieve this phenomenal increase in capacity NTPC plans to add 22600 MW in next five years.
DEVELOPMENTS OF 2008:
The core business of NTPC was thermal power generation. Now company has forayed into Hydro-power and is presently involved in three hydro projects; one in Himachal and two in Uttarakhand. The capacities of the project are 800MW in Himachal Pradesh and 600mw and 520MW project in Uttarkhand. All the three projects are expected to be completed before 2012.
NTPC signed MoU with ADB for establishment of power generation capacity 0f 500MW through renewable source of energy.
The company entered into a joint venture agreement with BSEB for setting up 3*660MW at Nabinagar, Bihar.
The company signed joint venture with UPRVUNL to set-up 2*660MW power project at Meja Tehsil in Allahabad, Uttar Pradesh.
A joint venture company with railway under the name of ‘Bharat Rail Bijlee Company limited’ was incorporated for setting 1000MW coal based power plant in Nabinagar, Bihar.
NTPC has formed joint ventured with Singareni Collieries to undertake coal mining in India and abroad.
ELEVENTH FIVE YEAR PLAN TARGET:
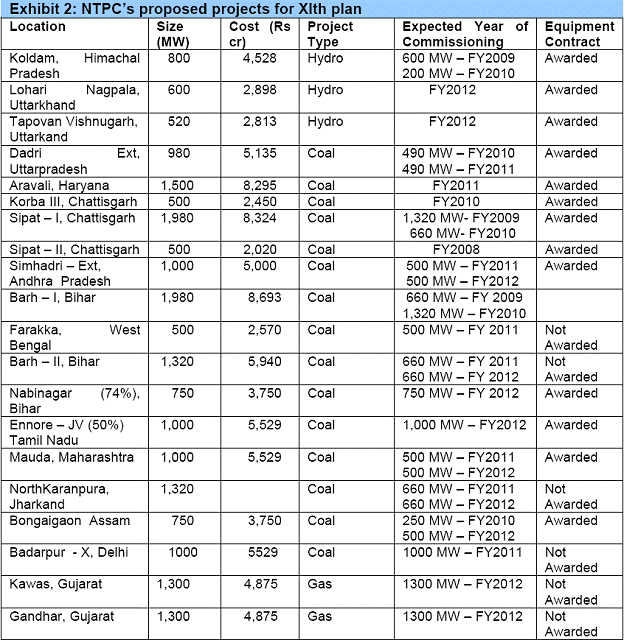 SOURCE: NTPC SOURCE: NTPC
INVESTMENT LOGIC:
Decreasing price of the raw material will help increase the operating margin in coming quarter.
Government focus on making power available to every individual will help Power Company increases their revenue.
In order to sustain growth in the economy power generation needs to be ramped up.
Despite ongoing liquidity crunch in the system the company is expected to go with their ongoing expansion because of the GOI backing.
NTPC Plant Availability Factor (PAL) is comparable to global peers. The availability factor has increased from 85% in FY1998 to 92.1% in FY 2008.The Plant Load Factor has increased from 75% to 92.2% in the same period.
Company has decided to diversify its generation mix by putting major thrust on hydro-electric, gas and nuclear power project.
KEY RISK:
Delay in ongoing expansion.
Change in government policy relating to tariff determination.
Increase in the prices of raw material.
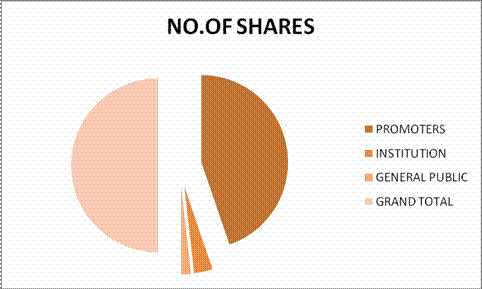
SHAREHOLDING PATTERN:
|
|
NO.OF SHARES |
% OF TOTAL |
PROMOTERS |
7379634400 |
|
89.50% |
|
INSTITUTION |
569997556 |
|
6.91% |
|
GENERAL PUBLIC |
295832444 |
|
3.59% |
|
GRAND TOTAL |
8245464400 |
|
100% |
|
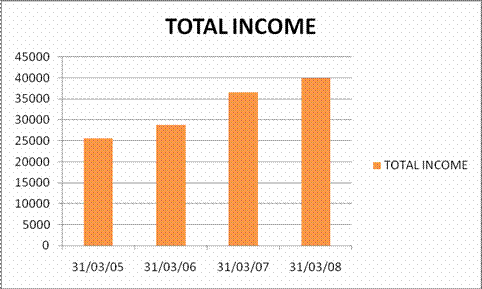
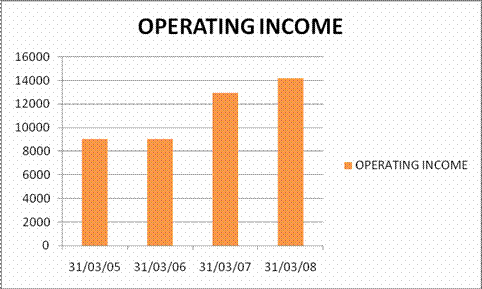
FINANCIAL:
|
|
31/03/05 |
31/03/06 |
31/03/07 |
31/03/08 |
TOTAL INCOME |
25546 |
28753 |
36651.8 |
40017.7 |
EXPENDITURE |
-16495.2 |
-19724.4 |
-23703.3 |
-25826.2 |
OPERATING INCOME |
9050.8 |
9028.6 |
12948.5 |
14191.5 |
DEPRECIATION |
-1958.4 |
-2047.7 |
-2099.8 |
-2138.5 |
PBIT |
|
7092.4 |
6980.9 |
10848.7 |
12053 |
INTEREST |
|
-1014.2 |
-958.5 |
-1887.3 |
-1798.1 |
PBT |
|
6078.2 |
6022.4 |
8961.4 |
10254.9 |
TAX |
|
-271.2 |
-202.2 |
-2063.1 |
-2840.1 |
PAT |
|
5807 |
5820.2 |
6898.3 |
7414.8 |
CHANGE IN TOTAL INCOME: CAGR IN TOTAL INCOME IS 16.13% OVER THE PERIOD OF 3 YEARS.
CHANGE IN OPERATING INCOME: CAGR IN OPERATING INCOME IS 16.17% OVER THE PERIOD OF 3 YEARS.
CHANGE IN NET PROFIT: CAGR IN NET PROFIT IS 8.48% OVER THE PERIOD OF 3 YEARS.

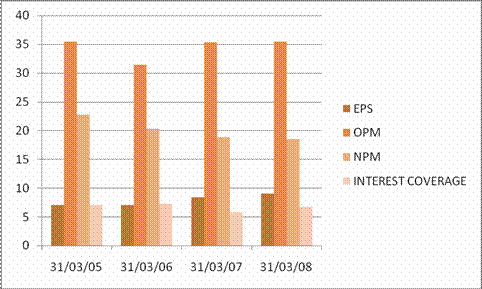
RATIOS:
|
|
31/03/05 |
31/03/06 |
31/03/07 |
31/03/08 |
|
EPS |
7.042715 |
7.058638 |
8.366139 |
8.992541 |
|
OPM |
35.42942 |
31.40055 |
35.32841 |
35.46306 |
|
NPM |
22.73154 |
20.24206 |
18.82118 |
18.5288 |
INTEREST COVERAGE |
6.993098 |
7.283151 |
5.748265 |
6.703187 |
EPS has moderately increased because high equity base. OPM has managed to remain healthy at 35% though there was a dip in 2006.Interest coverage is comfortable at 6.5 on an average of past 3 years.
COMPARISON OF Q2 FY2009 WITH Q2 FY2008:
|
|
30/09/07 |
|
30/09/08 |
TOTAL INCOME |
8749.2 |
18.93% |
10406.21 |
EXPENDITURE |
-5267.9 |
35% |
-7113.82 |
OPERATING INCOME |
3481.3 |
-5.40% |
3292.39 |
DEPRECIATION |
-513.4 |
2.50% |
-526.65 |
PBIT |
|
2967.9 |
-6.80% |
2765.74 |
INTEREST |
|
-496.4 |
6% |
-526.35 |
PBT |
|
2471.5 |
-9.40% |
2239.39 |
TAX |
|
-546 |
-76.40% |
-128.88 |
PAT |
|
1925.5 |
9.60% |
2110.51 |
VALUATION:
At CMP of Rs177, it is trading at PE multiple of 17x for FY2009E earning and 15x FOR FY2010E earning. We expect the EPS for FY2009E to be 10.4 and FY2010E to be 11.7.WACC is 10% and we expect the terminal growth rate of 5%.Now according to Discounted earning we arrive at valuation of Rs 208.
CONCLUSION:
Downside in the stock is limited. Investor with medium to long term perspective can accumulate on every dip. We expect a return of 15-20% from this level.
Find more Research Reports
Click here for Indian stock market tips
For more details click here
About Us |Site Map| Privacy Policy | Our Partners | Contact Us ||advertise with us |©2005sharetipinfo |