|
SHARETIPSINFO >>Research Reports >> SHREE RENUKA SUGAR (12-02-2009)
LISTING |
|
|
Rs 83 |
|
Rs1245/Rs41 |
|
Rs 1 |
PE |
28 |
P/BV |
0.87 |
COMPANY OVERVIEW:
Shree Renuka Sugars was incorporated in 1995. Initially it acquired 1250 tcd sick units of Andhra Pradesh government. The company plays a significant role in export/import due to its coastal position
Capacity and Location:
UNIT |
CANE(TCD) |
CO-GENERATION(MW) |
DISTILLERY(KLPD) |
REFINERY(TPD) |
|
|
|
|
|
1.MUNOLI,KARNATAKA(OWNED) |
7500 |
35.5 |
150 |
1000 |
2.ATHANI,KARNATAKA(OWNED) |
6000 |
38 |
150 |
1000 |
3.HAVALGAH,KARNATAKA(OWNED) |
4000 |
|
150 |
|
4.AJARA,MAHARASTRA(LEASED) |
2500 |
|
|
|
5.ARAG,MAHARASTRA((LEASED) |
4000 |
15 |
|
|
6.ALAND,KARNATAKA(LEASED) |
1250 |
|
|
|
7.HALDIA,WEST BENGAL(OWNED) |
- |
15 |
|
2000 |
TOTAL |
25250 |
103.5 |
450 |
4000 |
Product Mix:
Product Name |
Sales Value |
% Mix |
1.White Sugar |
910.24 |
46.37% |
2.Sugar |
733.08 |
37.34% |
3.Power |
183.78 |
9.36% |
4.Ethanol |
132.85 |
6.76% |
5.Others |
2.79 |
.14% |
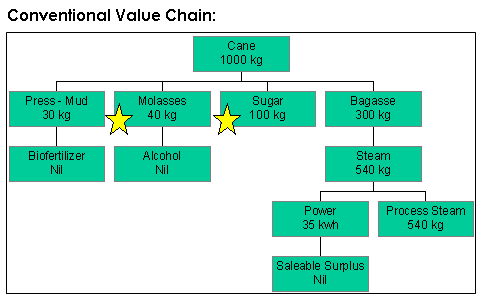
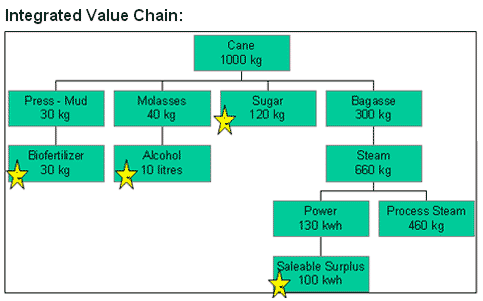
Product Obtained per 1000 kg of Sugar cane:
SECTORAL OUTLOOK:
The prices of sugar have risen 5%, 8%and 7% in Kolkata, Mumbai and Delhi, respectively since the beginning of January this year. The prices of sugar in fact have been registering big jumps both for the wholesale and the retail consumer countrywide since January last year. The rise in wholesale price was as high as 50% in some parts of the country since January 2008.
The jump in wholesale sugar price in run-up period to January 1, 2009, and since then up to January 9, 2009, in Kolkata was about 120 per quintal. In Mumbai the hike is Rs156 per quintal. In Delhi, the hike is Rs40 per quintal.
Much of the price hike towards 2008-end and early-2009 was driven by lower output estimates-only 180 lakh tones in the 2008-09 sugar year-compared to earlier estimates of 220 lakh tones.
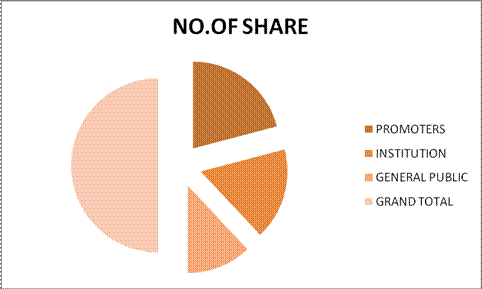
SHAREHOLDING PATTERN:
|
|
NO.OF SHARE |
% TOTAL |
PROMOTERS |
115408430 |
|
41.82% |
INSTITUTION |
94266054 |
|
34.16% |
GENERAL PUBLIC |
66288676 |
|
24.02% |
GRAND TOTAL |
275963160 |
|
100% |
FINANCIAL:
|
|
31/03/05 |
31/03/06 |
31/03/07 |
31/03/08 |
TOTAL INCOME |
675.04 |
839.7 |
773 |
1824.6 |
EXPENDITURE |
-604.66 |
-737.5 |
-657.2 |
-1602.6 |
OPERATING INCOME |
70.38 |
102.2 |
115.8 |
222 |
DEPRECIATION |
-8 |
-8.8 |
-24.9 |
-36.5 |
PBIT |
|
62.38 |
93.4 |
90.9 |
185.5 |
INTEREST |
|
-13.36 |
-18.8 |
-13.3 |
-68.5 |
PBT |
|
49.02 |
74.6 |
77.6 |
117 |
TAX |
|
-8.28 |
-18.3 |
-23.6 |
-39.2 |
EXTRA ORD. INC |
|
|
|
18.2 |
PAT |
|
40.74 |
56.3 |
54 |
96 |
CHANGE IN SALES: CAGR IN SALES IS 39.28%.
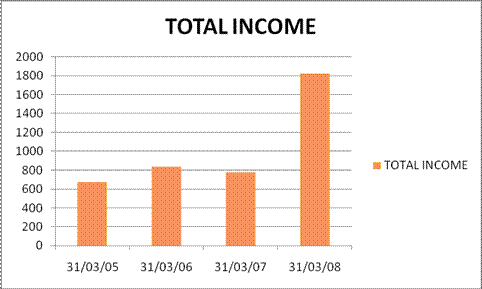
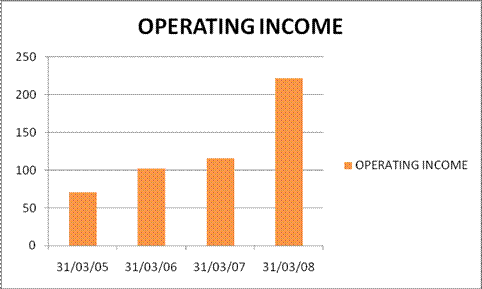
CHANGE IN OPERATING INCOME: CAGR IN OPERATING INCOME IS 46.65%.
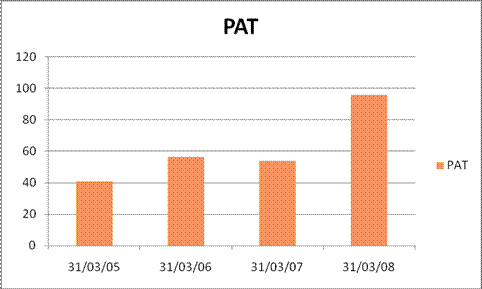
CHANGE IN NET PROFIT: CAGR IN NET PROFIT IS 33%.
RATIO:
|
|
31/03/05 |
31/03/06 |
31/03/07 |
31/03/08 |
|
EPS |
1.476087 |
2.0398551 |
1.956522 |
3.478261 |
|
OPM |
10.42605 |
12.171013 |
14.9806 |
12.16705 |
|
NPM |
6.035198 |
6.7047755 |
6.98577 |
5.261427 |
INTEREST INCOME |
4.669162 |
4.9680851 |
6.834586 |
2.708029 |
KEY HIGHLIGHTS:
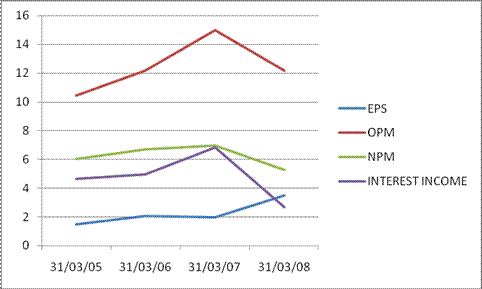
EPS increased from Rs1.47 to Rs3.4 even when the sugar industry was going through the bad phase.
OPM increased by 200 basis points. Company needs to increase it further as UP sugar mills operates at 20% OPM.
NPM has declined from 6.02% to 5.27%.
Interest cover has declined 4.6 to 2.7.
COMPARISION OF Q3FY2009 WITH Q3 FY2008:
|
|
31/12/07 |
%CHG |
31/12/08 |
TOTAL INCOME |
198 |
79.44% |
355.3 |
EXPENDITURE |
-167.1 |
|
-297.4 |
OPERATING INCOME |
30.9 |
87.40% |
57.9 |
DEPRECIATION |
-8 |
|
-13.4 |
PBIT |
|
22.9 |
|
44.5 |
INTEREST |
|
-9.3 |
|
-29 |
PBT |
|
13.6 |
|
15.5 |
TAX |
|
-4.6 |
|
-5.4 |
EXTRA ORD INCOME |
18.2 |
|
0 |
PAT |
|
27.2 |
-62.86% |
10.1 |
KEY HIGHLIGHTS:
TOTAL INCOME RISES BY 79.4%.
OPERATING INCOME INCREASES BY 87.4%
NET PROFIT DECLINED BY 62.86%. THIS IS DUE TO INCREASED INTEREST OUTGO AND EXTRAORDINARY INCOME THAT GOT ADDED IN PAT OF Q3FY2008.
VALUATION AND OUTLOOK:
We expect the significant increase in the earning in FY2010E. The EPS we are expecting for FY2010E is Rs12. The stock is trading at 6.5X to FY2010E EPS. We are valuing the company at 11x in 2010 due to change in the sugar cycle. The company valuation comes at Rs132/share. The counter gives the appreciation 65% from this level in 1 year.
CONCLUSION:
The counter will outperform the broad market. The investment horizon is 1 year. Investor should take position on every decline on the counter.
Find more Research Reports
Click here for Indian stock market tips
For more details click here
About Us |Site Map| Privacy Policy | Our Partners | Contact Us ||advertise with us |©2005sharetipinfo |
