http://sharetipsinfo.comJust get registered at Sharetipsinfo and earn positive returns

EUR/USD has bounced off the new two-year lows after US ISM Manufacturing Purchasing Manufacturing Index dropped below 50 and reflected a contraction in the critical sector. Can the world's most popular currency pair move extend its recovery?
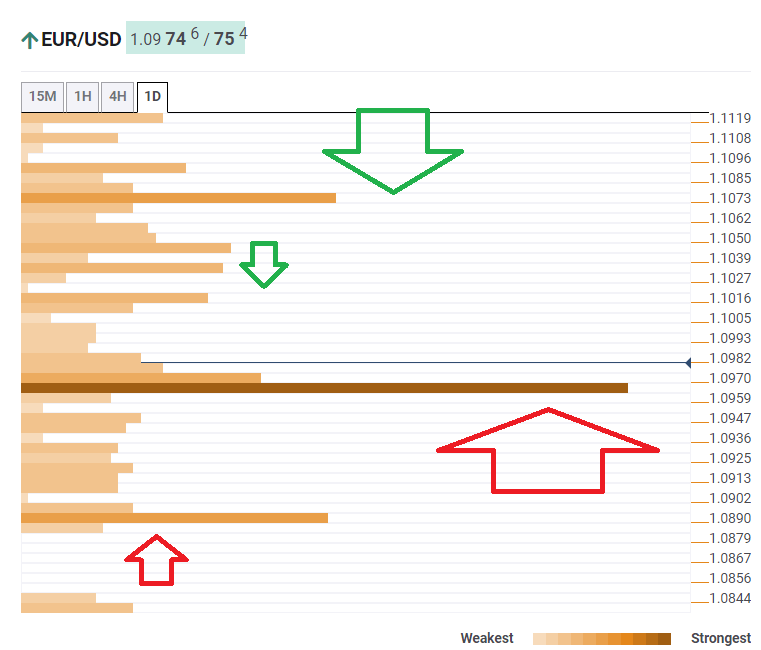
The Technical Confluences Indicator is showing that EUR/USD enjoys significant support at 1.0965, where we see a dense cluster including the Fibonacci 38.2% one-day, the Simple Moving Average 10-4h, the previous monthly low, the previous weekly low, the Bollinger Band 1h-Middle, the BB 1d-Lower, the Fibonacci 23.6% one-day, and the BB 15min-Lower. Looking up, some resistance awaits at 1.1016, where the Fibonacci 23.6% one-week meets the SMA 5-1d.
Several junctures of resistance await on the way up, with the most significant one awaiting at 1.1073, which is the where we see the confluence of the Fibonacci 61.8% one-week, the SMA 100-4h, and the Fibonacci 38.2% one-month.
Below 1.0965, the next support line is 1.0890, where the Pivot Point one-month Support 1 and the PP 1d-S3 converge.
Here is how it looks on the tool:
Here is how it looks on the tool:
Confluence Detector
The Confluence Detector finds exciting opportunities using Technical Confluences. The TC is a tool to locate and point out those price levels where there is a congestion of indicators, moving averages, Fibonacci levels, Pivot Points, etc. Knowing where these congestion points are located is very useful for the trader, and can be used as a basis for different strategies.
This tool assigns a certain amount of “weight” to each indicator, and this “weight” can influence adjacents price levels. These weightings mean that one price level without any indicator or moving average but under the influence of two “strongly weighted” levels accumulate more resistance than their neighbors. In these cases, the tool signals resistance in apparently empty areas.
Try Vip Forex Signals for profit